Process parameters
Laser Cleaning Fluence and Overlap: What a Supplier's Parameters Actually Prove
A parameter sheet from a demo or a paper is not a recipe for your part. How to normalise it, read the overlap, and decide whether to accept, re-test or reject.
9 min readBy LaserLuma technical team
Published
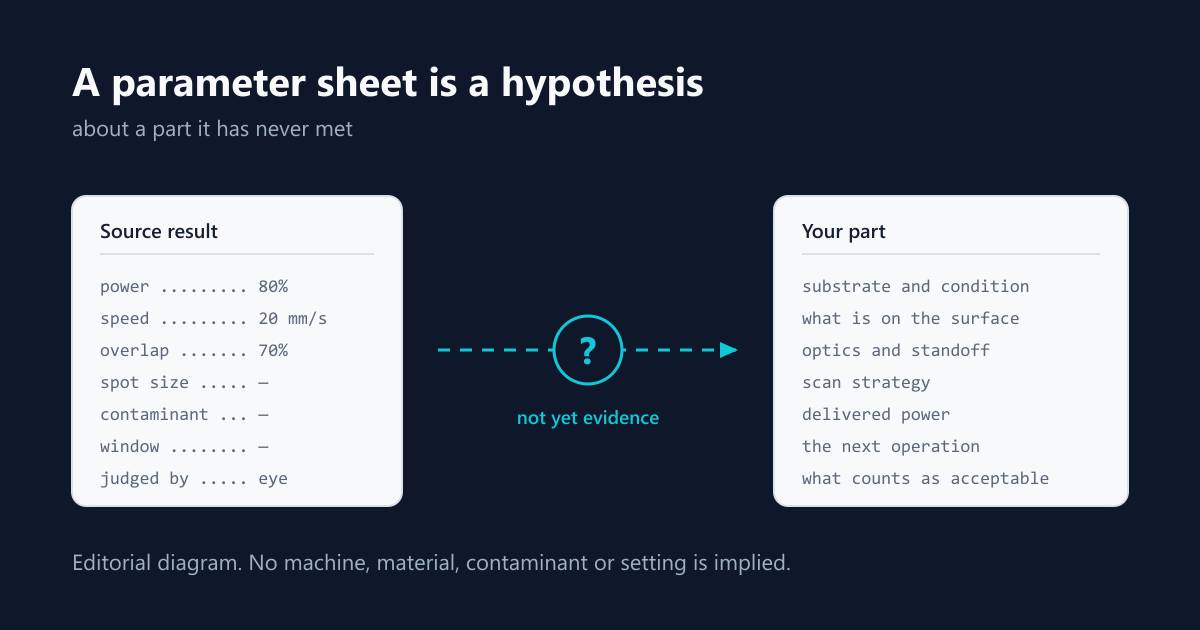
A parameter sheet from a supplier demo, a neighbouring production line or a published paper is a hypothesis about your part, not a recipe for it. Before it is worth testing, convert it to energy per pulse and energy per unit area, establish which overlap it refers to, and compare the contaminant and substrate it was produced on with yours. None of the published work reviewed for this article reports a universal fluence, overlap or power for laser cleaning, and none of its reported values carries over to a different material, contaminant or laser system without a fresh trial. The sheet earns one of three responses: accept it as a starting point for a test, re-test because it was produced on something different, or reject it as evidence.
Put both sheets in the same units before you compare them
Two quotations rarely describe their process the same way. One gives a power percentage and a travel speed. The other gives average power in watts, a repetition rate in kilohertz and a spot diameter in micrometres. Only the second can be reduced to the quantities that decide what happens at the surface.
Energy per pulse is average power divided by repetition rate. Energy per unit area is that pulse energy divided by the spot area, which means the spot diameter and the convention behind it both have to be stated. A sheet that gives none of these cannot be compared with one that does, and no amount of arithmetic recovers the missing inputs. The useful response is to list exactly which input is absent and ask for it, rather than estimating it and carrying the estimate forward as if it were data.
Two cautions travel with this conversion. A percentage of rated power is not a measurement of delivered power at the workpiece, because it says nothing about optical losses or the condition of the delivery optics. And a quoted "speed" may be the beam's motion inside a scan pattern or the robot's advance of the whole pattern; those are different quantities and a controller may expose only one of them.
Find out which overlap the sheet means
"70% overlap" on its own is an unresolved input. Pulses overlap each other along a scan line, set by scan speed, repetition rate and spot size. Adjacent scan lines overlap across the hatch, set by line spacing and spot size. The two are produced by different controls, and they are not interchangeable.
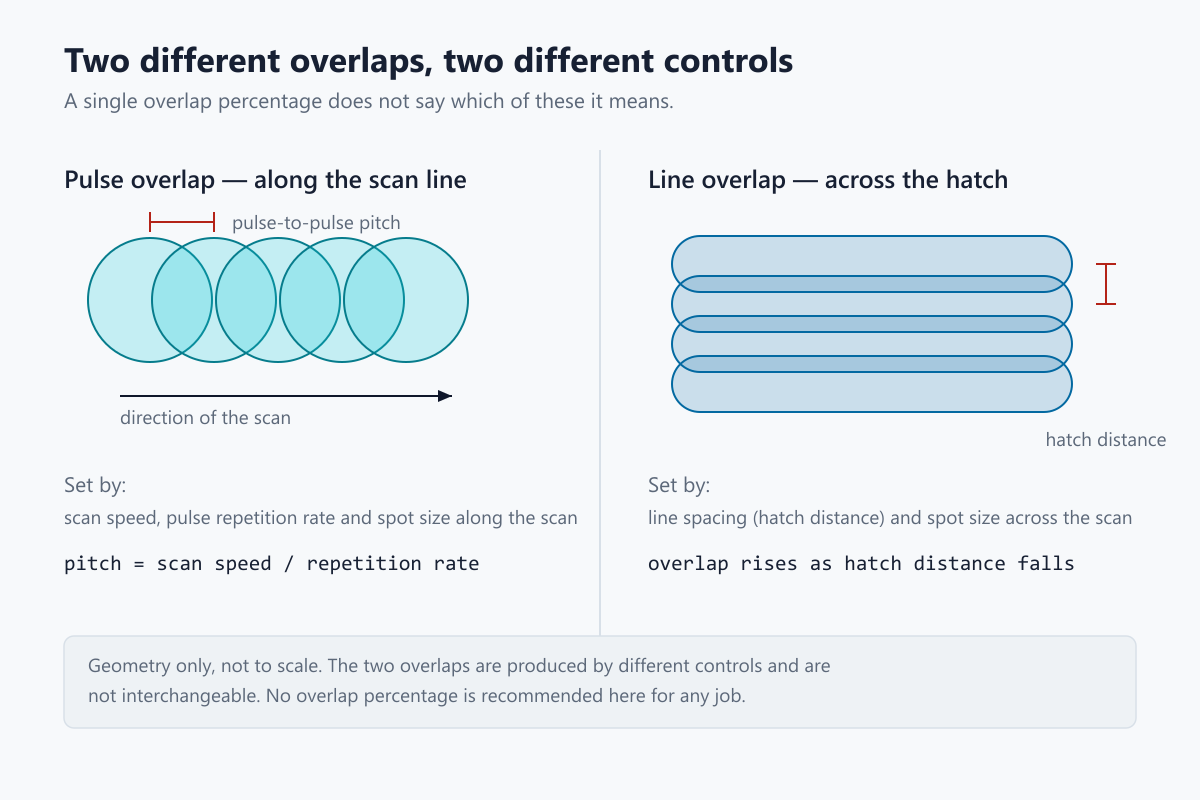
A study of pulse overlap and scanning line overlap on Ti6Al4V surfaces varied each between 40% and 90% and reported that the microstructures it was producing formed at lower levels of pulse overlap than at the corresponding value of line overlap, which the authors attribute to greater heat accumulation in the irradiated area. The same work reports that exceeding the strong ablation threshold of that alloy depended strongly on the scanning strategy.
That study used a 300 fs source for surface structuring, not industrial cleaning, and its fluences and overlap values are structuring parameters. The transferable point is narrower and more useful: the two overlaps are not one quantity under two names, and a threshold is not a constant that survives a change of scanning strategy. A sheet that states one overlap number without its axis has told you less than it appears to.
The cleaning threshold belongs to the contaminant, the damage threshold to the substrate
The most common way a transfer fails is that the source result was produced on something other than what is on your part.
A study of nanosecond pulsed cleaning of nickel-plated steel battery tabs measured this directly. Using one 1064 nm fibre laser, one substrate and one set of optics, the reported effective cleaning threshold was about 1.2 J/cm² for a dry organic residue and about 2.1 J/cm² for an oil film. Both contaminants were laboratory surrogates chosen for repeatability rather than taken from a production surface: a hand-applied permanent-marker film, and a synthetic ester oil deposited from solution to a weighed loading. The two numbers therefore establish that the threshold moves with the contaminant, not a value for your lubricant. The melting-regime thresholds measured on the same samples clustered near 5 J/cm² whatever was on the surface, so it was the removal threshold that moved, not the substrate's tolerance.
The reason is mechanical rather than statistical. Industrial oils are reported to act as largely transparent barriers at 1064 nm, so the energy passed through the film and was absorbed by the nickel beneath it; the oil was then displaced by substrate-mediated thermal expulsion rather than removed by direct ablation. A setting proven against a dry residue is not evidence about an oil film even on the same part, the same machine and the same day.
This is also where the scope of this article stops. Working out what is actually on your surface, and designing a staged trial around it, is a separate job with its own guide. What matters here is narrower: if the source sheet does not say which contaminant it was produced on, the comparison cannot be made.
Identifying what the oil or grease actually isWhat the beam actually cleaned is not the spot on the datasheet
Overlap arithmetic is usually built on the nominal spot diameter, which quietly assumes the cleaned width and the optical width are the same.
In the battery-tab study they were not. The study worked at a 2 mm defocus, where it states an on-surface spot radius of 62.15 µm; its specification table separately lists a 39 µm spot diameter at focus. Against that 62.15 µm, the effective radius in the cleaning regime reached roughly 69 µm on organic contamination and roughly 79 µm on oily surfaces, while in the melting regime it stayed within the 54.9 to 56.8 µm range the authors report, across every surface condition. The cleaning-regime figure expands with the contaminant because removal extends into the weaker outer parts of the beam, and for oil because material is propelled sideways well beyond the optical spot.
The practical consequence is that a stated overlap percentage describes the geometry of the nominal spot, not the coverage actually achieved. It remains a useful bookkeeping figure for reproducing a trial. It is not a measurement of whether the surface was covered.
Ask for the window, not the setting
A single number carries no information about how much headroom there was before the substrate was damaged. A window does.
A review of laser cleaning mechanisms and industrial applications reports one worked case: with a 1064 nm fibre laser removing sulfide scale from martensitic stainless steel, energy densities below 0.41 J/cm² produced no evident cleaning, values between 0.41 and 8.25 J/cm² removed the attachment without damage, and values above 8.25 J/cm² damaged the substrate.
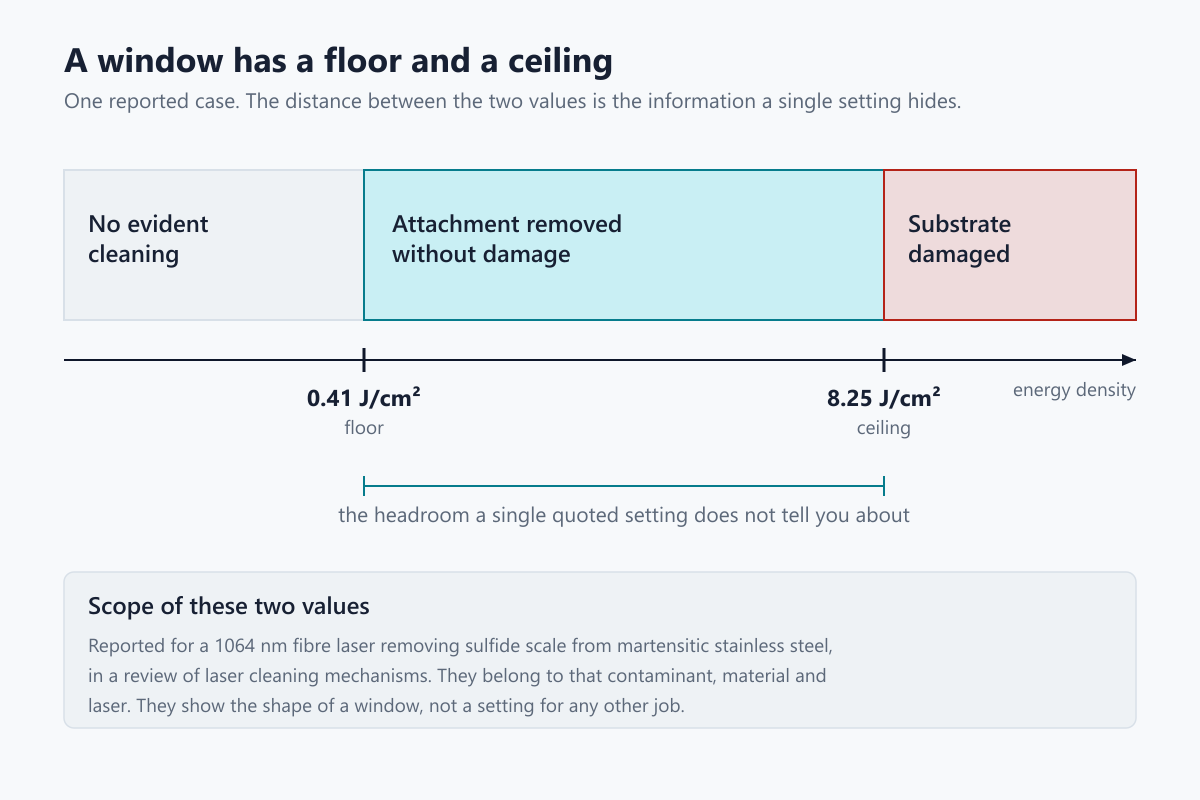
Those two numbers belong to that material and that laser. Reproduced here they illustrate the shape of the answer you should be asking for, a floor, a ceiling and the distance between them, not a setting to try. A supplier who can state where the ceiling was found has tested further than one who reports only the value that worked, and the gap between floor and ceiling is what tells you whether the process will survive normal variation in deposit thickness and standoff.
Do not accept appearance as the removal evidence
The demo coupon looked clean. That is the weakest evidence in the entire handover, and the same study shows why.
At the highest tested fluence of 9.9 J/cm², the surface was macroscopically homogenised by nickel remelting, yet micro-sized oil droplets persisted. A surface can pass visual inspection while still carrying the contamination that the next operation cares about. In the same work a measured property separated the two cases: water contact angle fell from above 70° on unprocessed surfaces to a stable 45–55° once fluence reached the 6.9–9.9 J/cm² range, with oil-contaminated samples remaining slightly above the clean reference.
Contact angle was the property that study chose; it is not an acceptance test for your job. The transferable point is that the measurement must be the one the following operation depends on. When that operation is welding, the trial should be judged against the weld procedure's own requirement rather than against how the coupon looks under shop lighting.
What the weld procedure needs the surface to passDecide: accept as a starting point, re-test, or reject
Use this as a sorting tool for a sheet you have been handed. Work down it and stop at the first row that describes your sheet; the rows are ordered so that the conditions which disqualify a sheet come before the ones that merely qualify it. Each row resolves to one of the same three actions, with the reason that forces it. The table does not predict whether the settings will work, and none of the three actions removes the need for a test on a representative part.
| What the sheet establishes | Action | What to keep |
|---|---|---|
| Missing spot size, power basis or overlap axis | Reject for now and send it back for the missing input, before any trial is planned | The list of absent inputs, in writing |
| Judged only by appearance, with no measurement tied to the next operation | Reject as evidence; the trial has to define its own acceptance measurement | The next operation's actual requirement |
| Reports only a single setting with no indication of where damage began | Re-test, asking for the window and planning the trial to find the ceiling as well as the floor | Whatever bounds the supplier can evidence |
| Normalises cleanly but was produced on a different contaminant, substrate or surface condition | Re-test, treating the sheet as a starting region rather than a setting | The source conditions and the specific difference that forces the retest |
| Normalises to energy per pulse and energy per unit area, states the overlap axis, and was produced on the same contaminant and substrate class | Accept as the starting point for a trial on a representative part | The normalised values, the source conditions, and the measurement used to judge removal |
Write down what would invalidate the transfer before you test
Decide in advance what changes would make the result meaningless, because that list is far easier to write before a result exists than after one does.
At minimum, record the substrate and its condition, what is on the surface and how it got there, the machine and source mode, the optics, standoff and spot definition, the basis of the power figure, the repetition rate and pulse duration, the scan pattern with both overlaps stated separately, the pass count, and the measurement used to judge removal. Then record what forces a fresh trial: a different coating or deposit, a different alloy or thickness, different optics or standoff, a change of scan strategy, or a change in the requirement of the operation that follows.
This is also the record that makes your next comparison possible. The reason two parameter sheets usually cannot be compared is that nobody wrote this down the first time.
Take the sheet and the part to a sample test
Once the sheet is normalised and its gaps are listed, the remaining questions are answered by a trial on a representative part rather than by further reading. Bring the sheet with its missing inputs identified, the substrate and its condition, what is on the surface, the operation that follows cleaning and what it requires, and what would make the result unacceptable. Those five inputs are what turns an inherited parameter set into a test that produces evidence about your part.
Request a sample testFAQs
Can I just copy the fluence from a published laser cleaning study?
No. Published values are tied to the material, contaminant, wavelength, pulse duration and optics of that experiment. The reported window of 0.41 to 8.25 J/cm² above applies to sulfide scale on martensitic stainless steel with a 1064 nm fibre laser, and nothing in the reviewed literature establishes that any such window transfers to another combination. Use published work to understand the shape of the question and to justify a trial, not to pick a number.
The supplier's demo part came out clean. Is that not enough?
Not by itself. A macroscopically clean surface was shown in the battery-tab study to coexist with residual oil droplets at the highest tested fluence. Ask what was measured rather than what was seen, and whether that measurement is the one your next operation depends on.
My parameter sheet says 70% overlap. Is that pulse overlap or line overlap?
The sheet has to say. Pulse overlap along the scan and line overlap across the hatch are set by different controls. In a femtosecond study that structured Ti6Al4V surfaces rather than cleaned them, the structures being produced appeared at lower pulse overlap than at the equivalent line-overlap value, which is reason enough not to treat the two as one number. Until the axis is stated, treat the figure as a missing input rather than a parameter.